- Home
- Administration
- Aeronautics
- Business with WYDOT
- Construction Projects
- Driver License and Records
- Economic Stimulus Projects (ARRA - TIGER)
- Engineering and Technical Programs
- Fuel Tax
- Highway Safety
- Human Resources
- Manuals and Publications
- News and Information
- Permits
- Planning/Projects/Research
- Titles, Plates and Registration
- Travel
- Trucking / Commercial Vehicles
- Vehicle Business Regulation
- Wyoming Highway Patrol
- Search
- Sitemap

Fun Facts
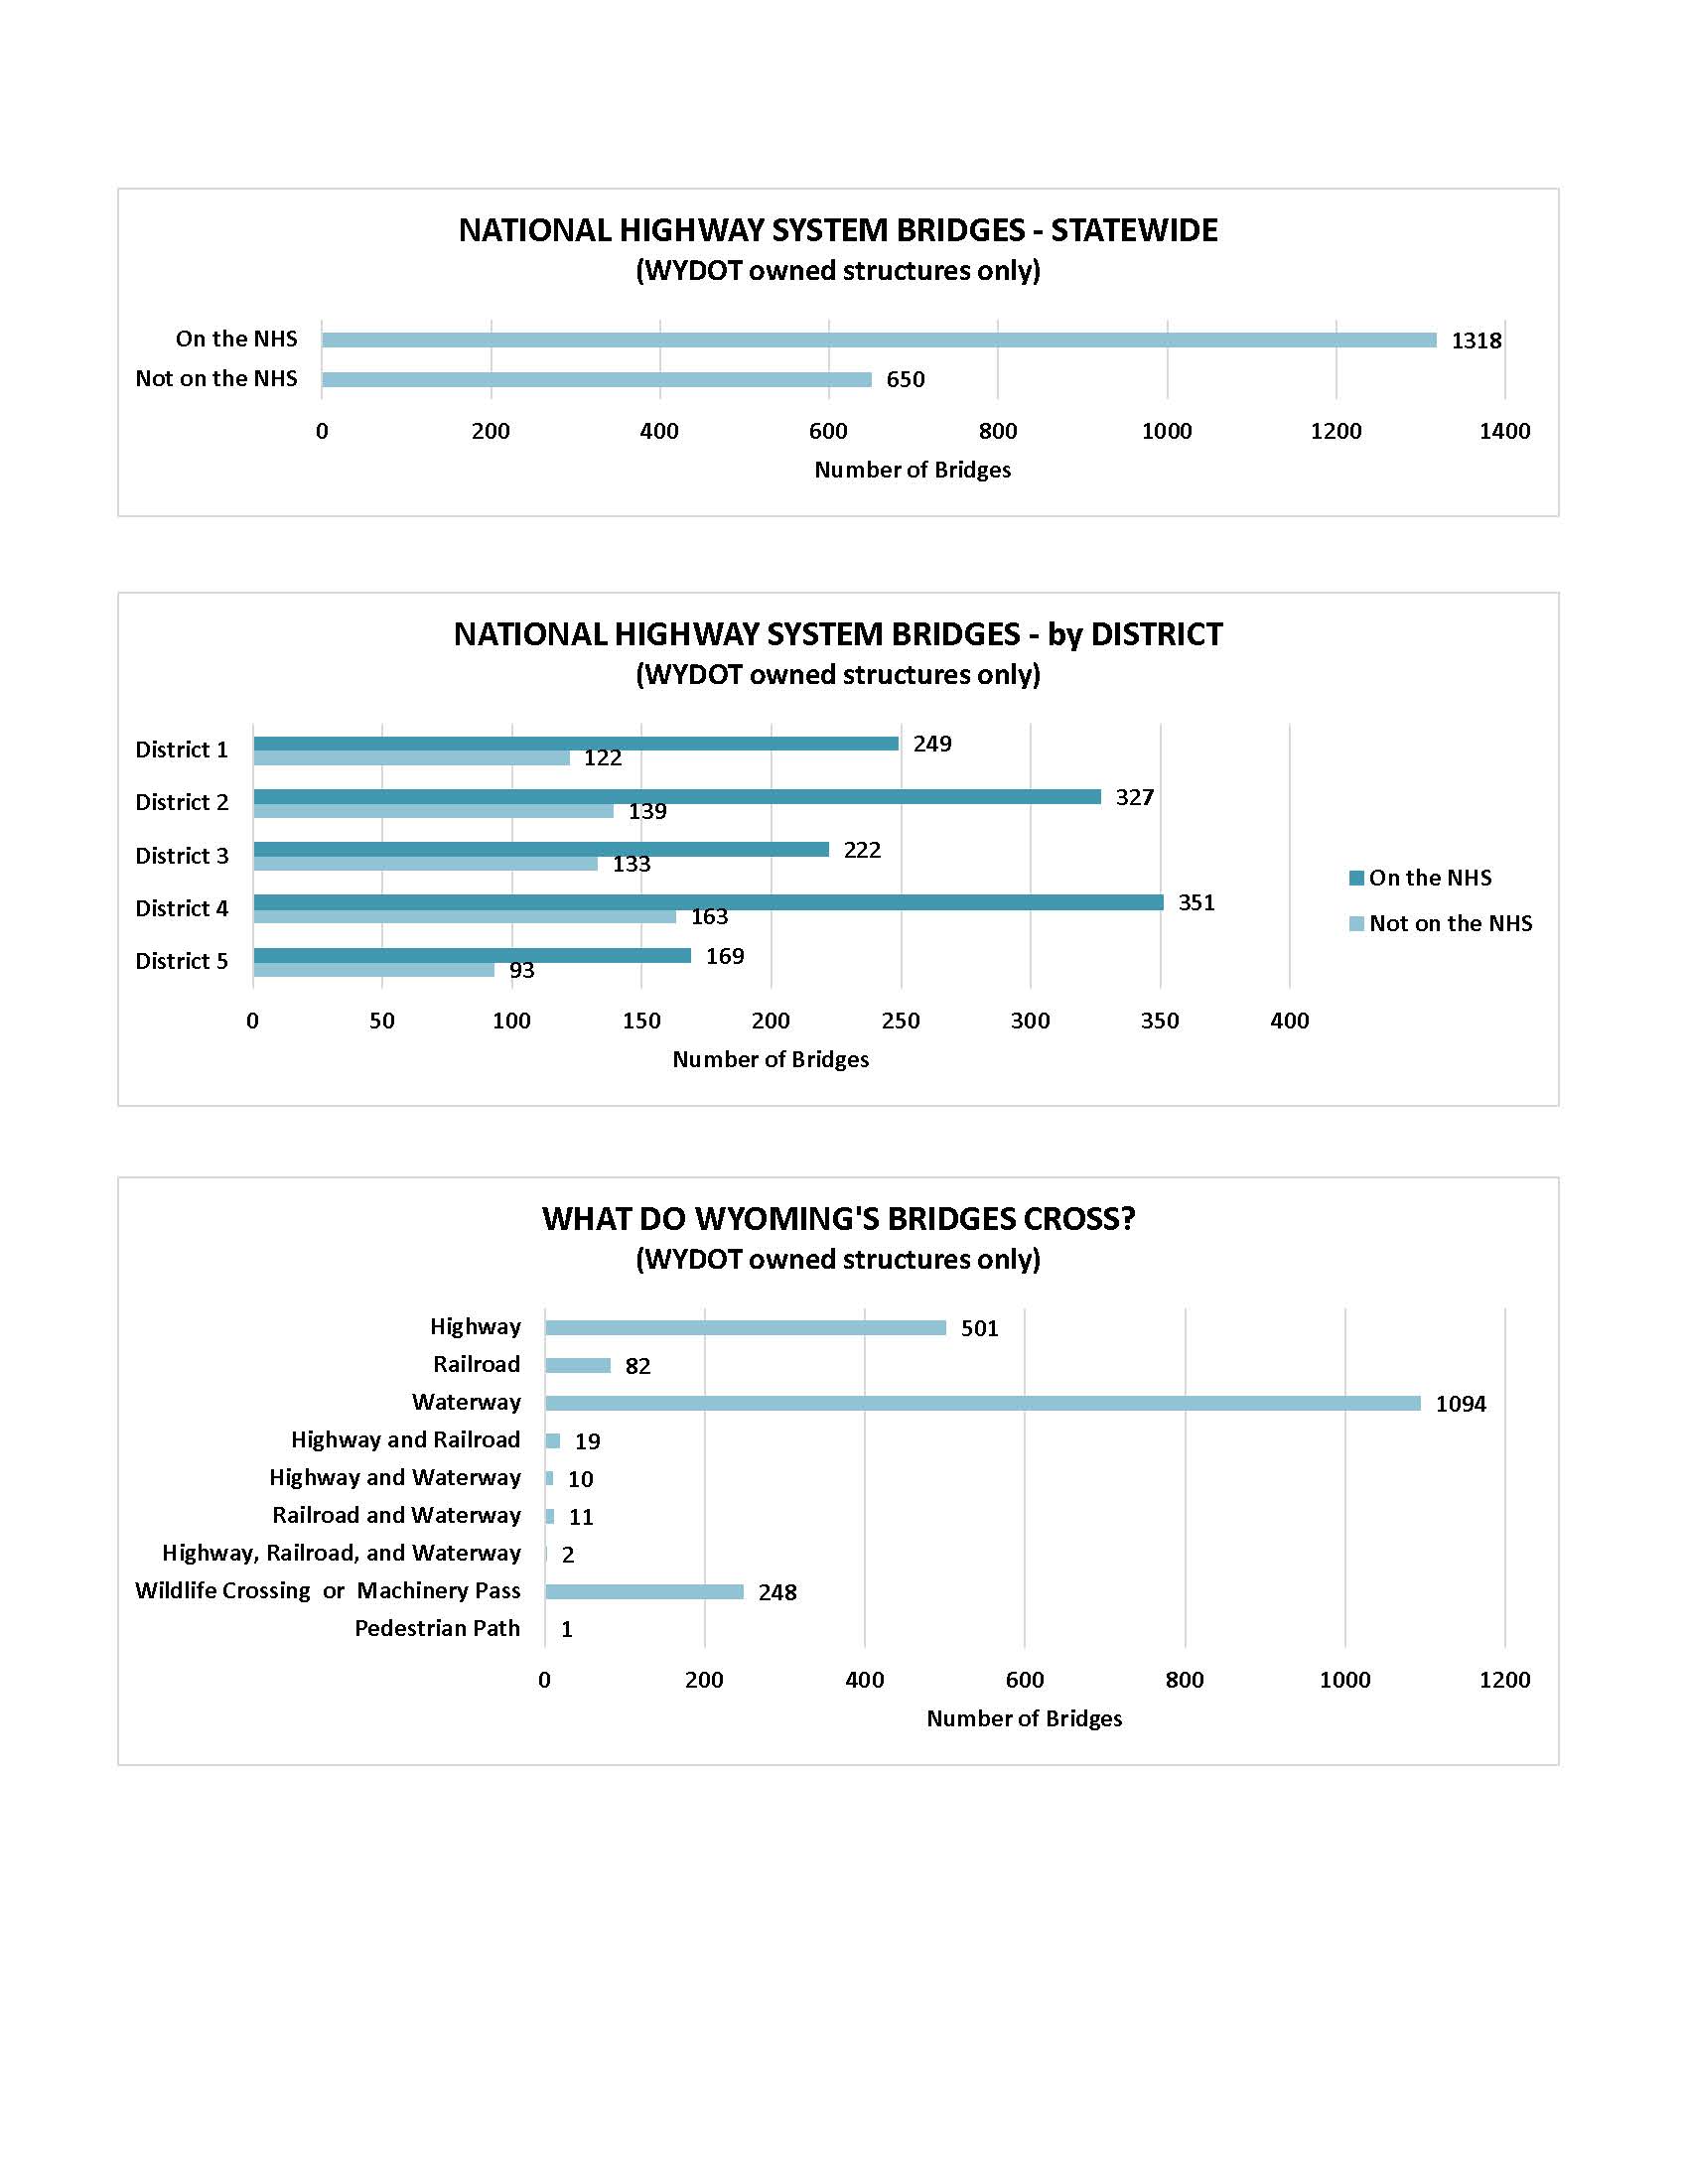
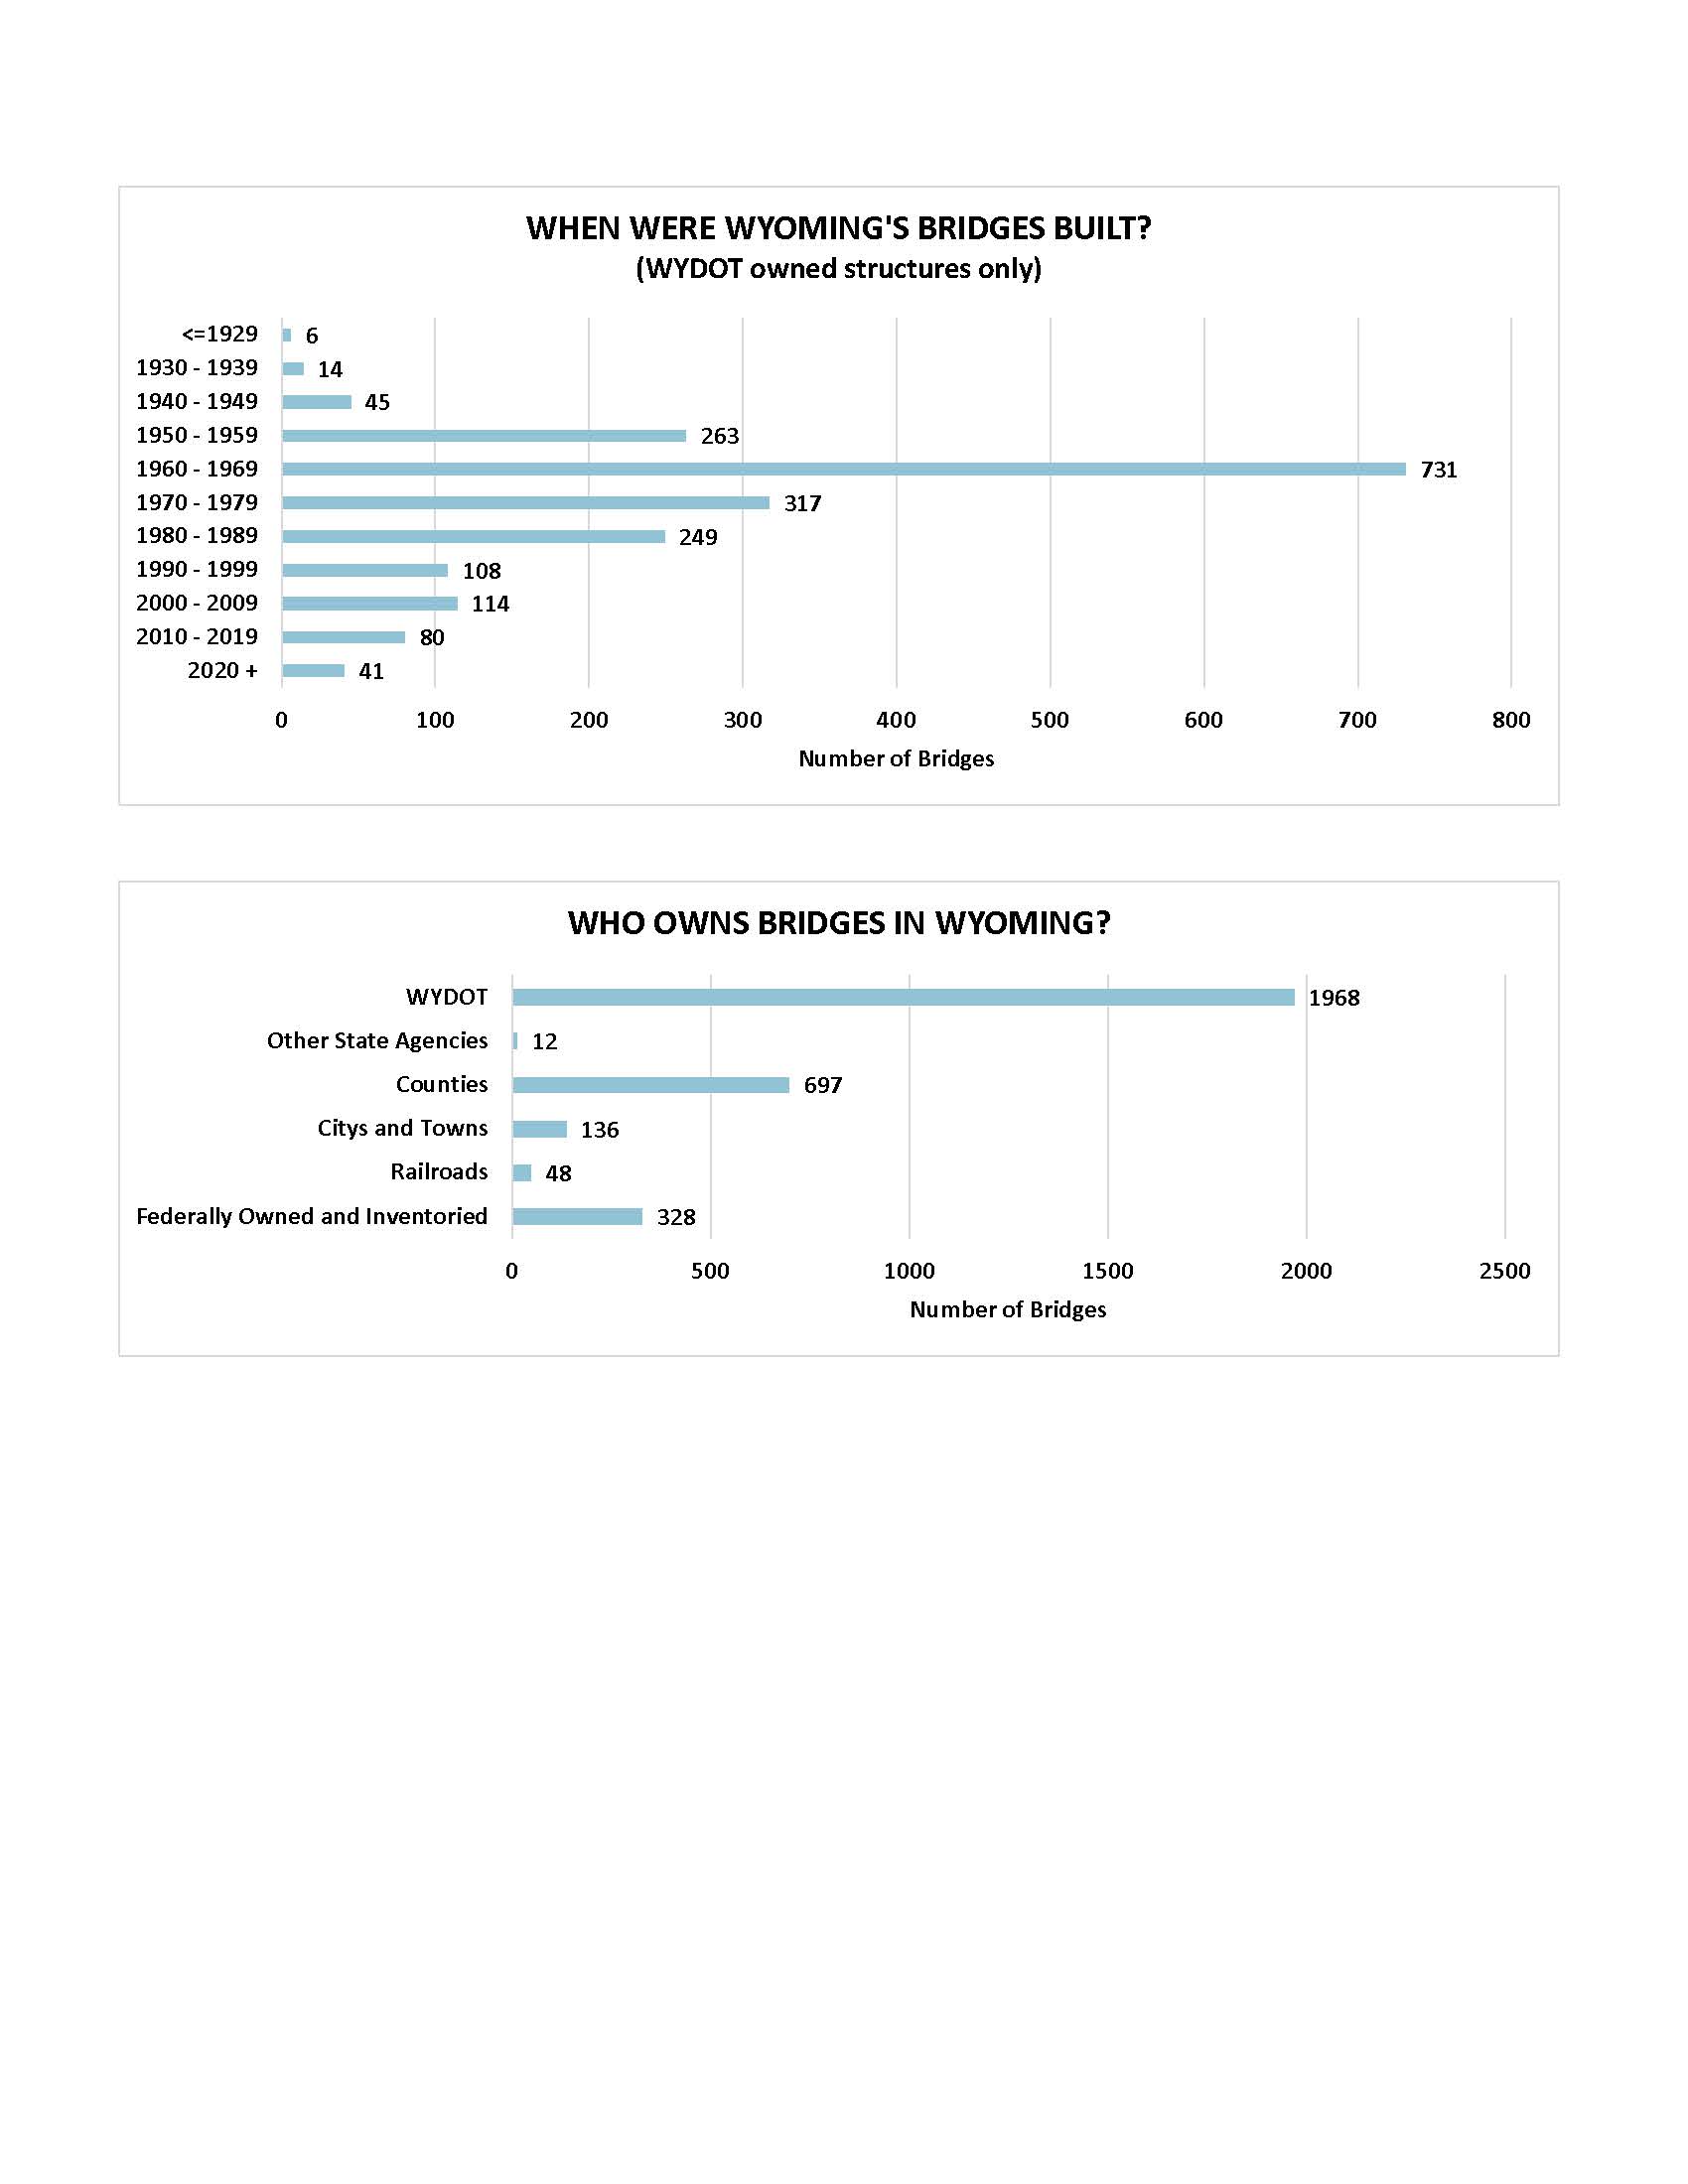
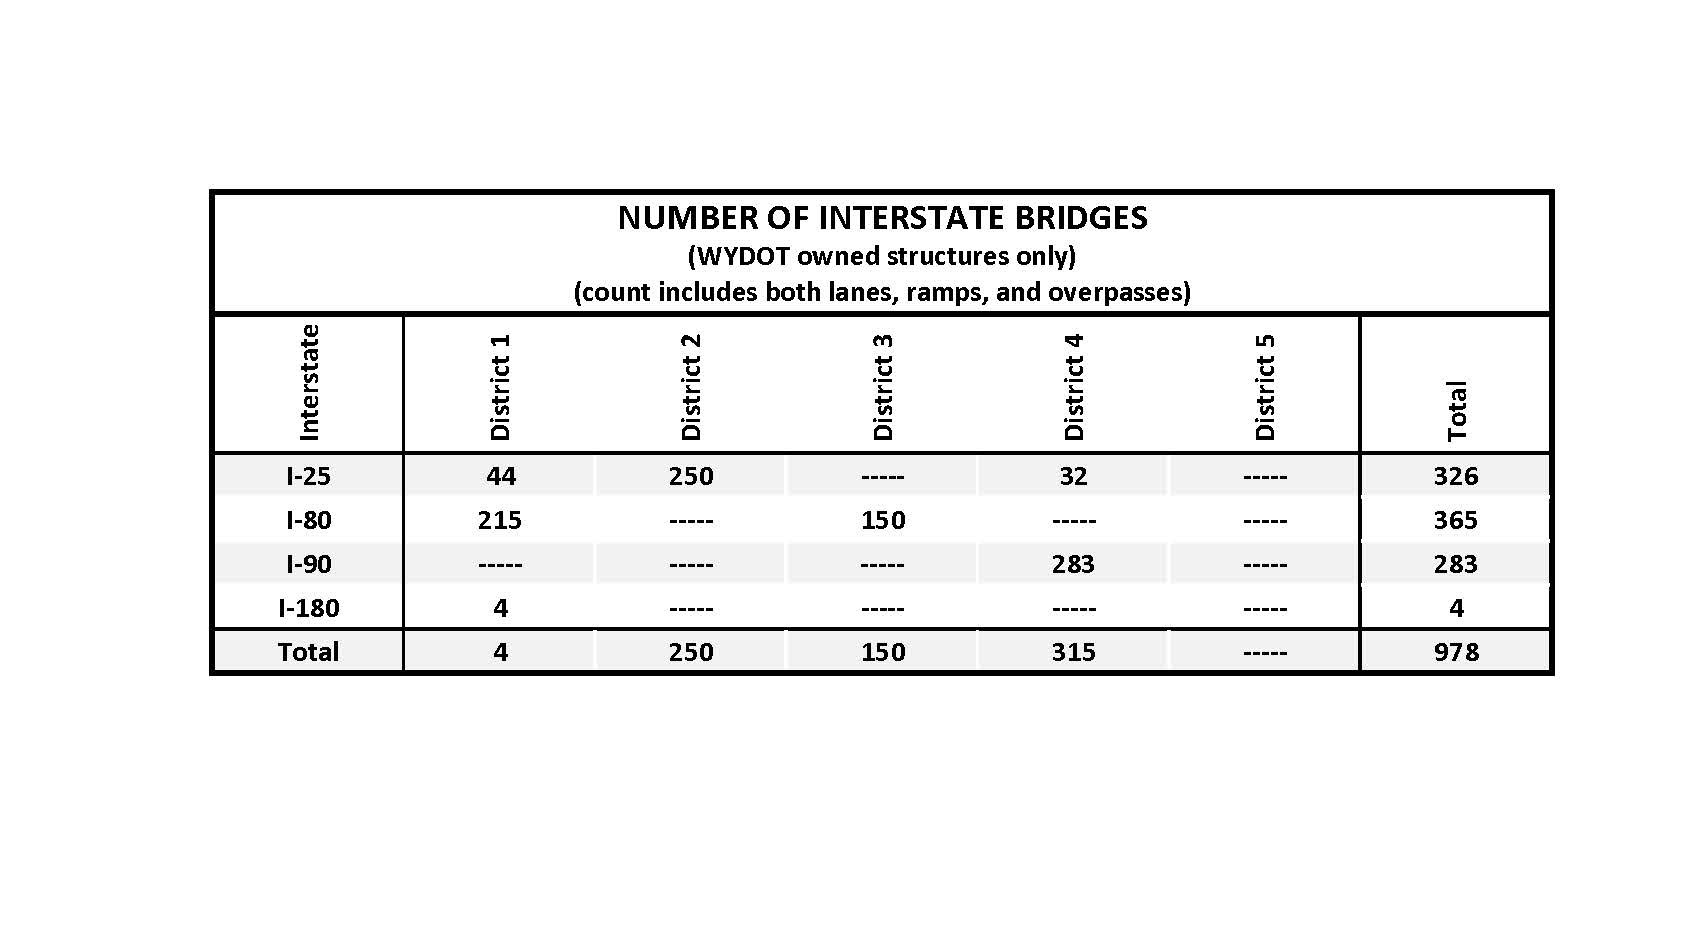
Bridge Statistics
The following graphs contain statistical information with respect to number, age, and condition of State-owned (on system) bridges.
Source: Bridge Program. Last updated March 2, 2026